WelcomE
TO
&
3rd
Anniversary
Party


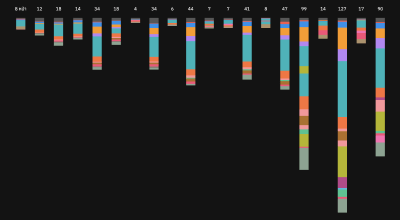
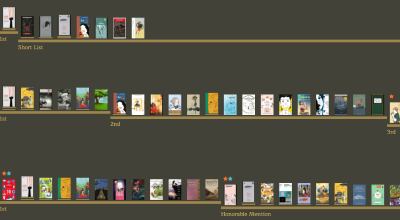
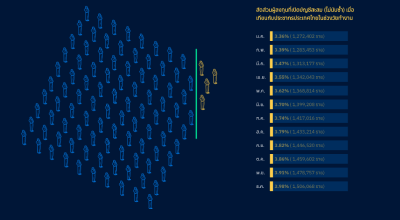
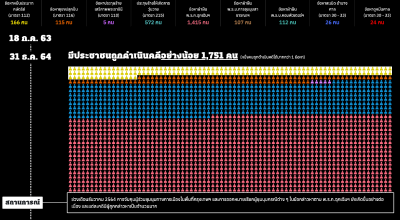
145 glasses
เราเตรียมคอกเทลสูตรพิเศษ 145 เเก้ว ที่ดึงส่วนผสมสำคัญ
ตัวเเทนของ 86 Projects เเละ 59 งาน Infographics
ที่พวกเราตั้งใจชงมาตลอด 3 ปี ให้เลือกชิม
ถ้าพร้อมเเล้ว ลองดูที่บาร์แล้วกดเลือกแก้วที่คุณสนใจ
ตัวเเทนของ 86 Projects เเละ 59 งาน Infographics
ที่พวกเราตั้งใจชงมาตลอด 3 ปี ให้เลือกชิม
ถ้าพร้อมเเล้ว ลองดูที่บาร์แล้วกดเลือกแก้วที่คุณสนใจ